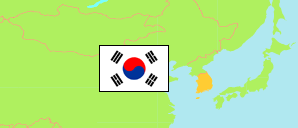
Jeju-do (South Korea)
Special Autonomous Province
The population development of Jeju-do.
| Name | Native | Status | Population Census 2005-11-01 | Population Census 2010-11-01 | Population Census 2015-11-01 | Population Census 2020-11-01 | |
|---|---|---|---|---|---|---|---|
| Jeju-do | 제주특별자치도 | Special Autonomous Province | 531,887 | 531,905 | 605,619 | 670,858 | → |
| Daehan Minguk [South Korea] | 대한민국 | Republic | 47,278,951 | 48,580,293 | 51,069,375 | 51,829,136 |
Contents: Urban Areas and Towns
The population development of the urban areas and towns in Jeju-do.
| Name | Native | Status | Province | Population Census 2005-11-01 | Population Census 2010-11-01 | Population Census 2015-11-01 | Population Census 2020-11-01 | |
|---|---|---|---|---|---|---|---|---|
| Aewol | 애월읍 | Town | Jeju-do | ... | 23,758 | 29,105 | 36,146 | → |
| Daejeong | 대정읍 | Town | Jeju-do | ... | 14,020 | 17,600 | 22,773 | → |
| Gujwa | 구좌읍 | Town | Jeju-do | ... | 10,939 | 13,148 | 14,774 | → |
| Hallim | 한림읍 | Town | Jeju-do | ... | 16,550 | 19,477 | 22,230 | → |
| Jeju | 제주 | Urban Area | Jeju-do | 311,281 | 322,005 | 358,812 | 382,296 | → |
| Jocheon | 조천읍 | Town | Jeju-do | ... | 17,958 | 19,696 | 24,579 | → |
| Namwon | 남원읍 | Town | Jeju-do | ... | 14,176 | 16,825 | 17,957 | → |
| Seogwipo | 서귀포 | Urban Area | Jeju-do | 78,369 | 75,177 | 86,595 | 99,256 | → |
| Seongsan | 성산읍 | Town | Jeju-do | ... | 11,188 | 13,283 | 15,308 | → |
Source: National Statistical Office of the Republic of Korea (web).
Explanation: Since 2015, a register-based census is performed. Nevertheless, the results are not consistent with the population figures from the resident registration that are higher by about 3.5% on average. Area figures are derived from geospatial data.