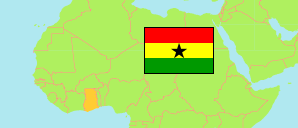
New Juaben North Municipal
Municipal District in Ghana
Contents: Population
The population development of New Juaben North Municipal as well as related information and services (Wikipedia, Google, images).
| Name | Status | Population Census 2010-09-26 | Population Census 2021-06-27 | |
|---|---|---|---|---|
| New Juaben North Municipal | Municipal District | 58,735 | 93,201 | |
| Ghana | Republic | 24,658,823 | 30,832,019 |
Source: Ghana Statistical Service (web).
Explanation: Area figures of districts are derived from geospatial data.
Further information about the population structure:
| Gender (C 2021) | |
|---|---|
| Males | 46,402 |
| Females | 46,799 |
| Age Groups (C 2021) | |
|---|---|
| 0-14 years | 26,670 |
| 15-64 years | 61,827 |
| 65+ years | 4,704 |
| Age Distribution (C 2021) | |
|---|---|
| 80+ years | 1,144 |
| 70-79 years | 1,885 |
| 60-69 years | 4,132 |
| 50-59 years | 5,542 |
| 40-49 years | 9,039 |
| 30-39 years | 13,956 |
| 20-29 years | 16,446 |
| 10-19 years | 23,382 |
| 0-9 years | 17,675 |
| Urbanization (C 2021) | |
|---|---|
| Rural | 16,368 |
| Urban | 76,833 |
| Literacy (A11+) (C 2021) | |
|---|---|
| yes | 66,046 |
| no | 7,442 |
| Ethnic Group (C 2021) | |
|---|---|
| Akan | 58,680 |
| Ga-Dangme | 8,898 |
| Ewe | 11,780 |
| Guan | 1,129 |
| Gurma | 1,943 |
| Mole-Dagbani | 4,954 |
| Grusi | 1,243 |
| Mandé | 797 |
| Other Ethnic Group | 3,174 |