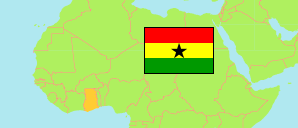
Eastern
Region in Ghana
Contents: Subdivision
The population development in Eastern as well as related information and services (Wikipedia, Google, images).
| Name | Status | Population Census 2010-09-26 | Population Census 2021-06-27 | |
|---|---|---|---|---|
| Eastern | Region | 2,633,154 | 2,925,653 | |
| Abuakwa North Municipal (← East Akim Municipal) | Municipal District | 89,548 | 91,297 | → |
| Abuakwa South Municipal (← East Akim Municipal) | Municipal District | 78,348 | 73,949 | → |
| Achiase (← Birim South) | District | 73,216 | 56,348 | → |
| Akuapim North Municipal | Municipal District | 75,771 | 105,315 | → |
| Akwapim South | District | 37,501 | 76,922 | → |
| Akyemansa | District | 97,374 | 91,038 | → |
| Asene Manso-Akroso (← Birim Central Municipal) | District | 76,876 | 77,498 | → |
| Asuogyaman | District | 98,046 | 101,256 | → |
| Atiwa East | District | 49,636 | 64,647 | → |
| Atiwa West | District | 60,986 | 61,219 | → |
| Ayensuano | District | 77,193 | 94,594 | → |
| Birim Central Municipal | Municipal District | 67,993 | 76,302 | → |
| Birim North | District | 78,907 | 82,669 | → |
| Birim South | District | 46,551 | 35,654 | → |
| Denkyembour | District | 78,841 | 77,029 | → |
| Fanteakwa North | District | 59,430 | 56,987 | → |
| Fanteakwa South | District | 49,184 | 54,634 | → |
| Kwaebibirem Municipal | Municipal District | 113,721 | 121,698 | → |
| Kwahu Afram Plains North | District | 102,423 | 66,555 | → |
| Kwahu Afram Plains South | District | 115,812 | 74,002 | → |
| Kwahu East | District | 77,125 | 79,726 | → |
| Kwahu South | District | 69,757 | 80,358 | → |
| Kwahu West Municipal | Municipal District | 93,584 | 145,429 | → |
| Lower Manya Krobo Municipal | Municipal District | 89,246 | 121,478 | → |
| New Juaben North Municipal | Municipal District | 58,735 | 93,201 | → |
| New Juaben South Municipal | Municipal District | 124,992 | 125,256 | → |
| Nsawam Adoagyiri Municipal | Municipal District | 86,000 | 155,597 | → |
| Okere (← Akwapim North Municipal) | District | 60,712 | 51,675 | → |
| Suhum Municipal | Municipal District | 90,358 | 126,403 | → |
| Upper Manya Krobo | District | 72,092 | 70,676 | → |
| Upper West Akim | District | 87,051 | 93,391 | → |
| West Akim Municipal | Municipal District | 108,298 | 120,145 | → |
| Yilo Krobo Municipal | Municipal District | 87,847 | 122,705 | → |
| Ghana | Republic | 24,658,823 | 30,832,019 |
Source: Ghana Statistical Service (web).
Explanation: Area figures of districts are derived from geospatial data.
Further information about the population structure:
| Gender (C 2021) | |
|---|---|
| Males | 1,436,951 |
| Females | 1,488,702 |
| Age Groups (C 2021) | |
|---|---|
| 0-14 years | 985,488 |
| 15-64 years | 1,773,355 |
| 65+ years | 166,810 |
| Age Distribution (C 2021) | |
|---|---|
| 80+ years | 42,153 |
| 70-79 years | 67,923 |
| 60-69 years | 138,709 |
| 50-59 years | 202,215 |
| 40-49 years | 282,774 |
| 30-39 years | 398,619 |
| 20-29 years | 467,229 |
| 10-19 years | 665,269 |
| 0-9 years | 660,762 |
| Urbanization (C 2021) | |
|---|---|
| Rural | 1,298,011 |
| Urban | 1,505,820 |
| Literacy (A11+) (C 2021) | |
|---|---|
| yes | 1,729,016 |
| no | 462,811 |
| Ethnic Group (C 2021) | |
|---|---|
| Akan | 1,551,156 |
| Ga-Dangme | 528,482 |
| Ewe | 497,143 |
| Guan | 100,362 |
| Gurma | 43,896 |
| Mole-Dagbani | 99,237 |
| Grusi | 25,338 |
| Mandé | 11,909 |
| Other Ethnic Group | 48,494 |