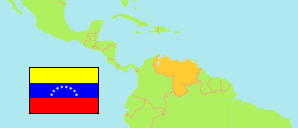
Sucre
State in Venezuela
Contents: Subdivision
The population development in Sucre as well as related information and services (Wikipedia, Google, images).
| Name | Status | Population Estimate 2001-06-30 | Population Estimate 2011-06-30 | Population Projection 2019-06-30 | |
|---|---|---|---|---|---|
| Sucre | State | 840,611 | 965,451 | 1,091,328 | |
| Andrés Eloy Blanco | Municipality | 24,553 | 27,934 | 31,342 | → |
| Andrés Mata | Municipality | 18,022 | 20,731 | 23,466 | → |
| Arismendi | Municipality | 43,439 | 49,676 | 55,969 | → |
| Benítez | Municipality | 29,338 | 33,185 | 37,062 | → |
| Bermúdez | Municipality | 130,773 | 147,848 | 165,059 | → |
| Bolívar | Municipality | 20,015 | 23,057 | 26,131 | → |
| Cajigal | Municipality | 19,205 | 22,138 | 25,101 | → |
| Cruz Salmerón Acosta | Municipality | 33,150 | 37,482 | 41,850 | → |
| Libertador | Municipality | 8,802 | 10,081 | 11,372 | → |
| Mariño | Municipality | 22,143 | 25,351 | 28,588 | → |
| Mejía | Municipality | 12,910 | 14,800 | 16,708 | → |
| Montes | Municipality | 49,231 | 56,294 | 63,421 | → |
| Ribero | Municipality | 56,826 | 64,400 | 72,035 | → |
| Sucre | Municipality | 335,026 | 389,555 | 444,503 | → |
| Valdez | Municipality | 37,178 | 42,919 | 48,721 | → |
| Venezuela | Republic | 24,802,885 | 28,944,070 | 32,219,521 |
Source: Instituto Nacional de Estadística, Venezuela (web).
Explanation: The population projection does not consider emigration caused by the current economical and political situation in Venezuela.
Further information about the population structure:
| Gender (C 2011) | |
|---|---|
| Males | 450,533 |
| Females | 445,758 |
| Age Groups (C 2011) | |
|---|---|
| 0-14 years | 251,270 |
| 15-64 years | 583,670 |
| 65+ years | 61,351 |
| Age Distribution (C 2011) | |
|---|---|
| 0-9 years | 162,138 |
| 10-19 years | 181,957 |
| 20-29 years | 153,962 |
| 30-39 years | 131,418 |
| 40-49 years | 100,988 |
| 50-59 years | 75,891 |
| 60-69 years | 48,951 |
| 70-79 years | 27,131 |
| 80+ years | 13,855 |
| Urbanization (C 2011) | |
|---|---|
| Rural | 162,085 |
| Urban | 734,206 |
| Ethnic Group (C 2011) | |
|---|---|
| Indigenous | 22,213 |
| Afro-Venezuelan | 42,189 |
| Mestizos | 476,053 |
| White | 335,199 |
| Other Ethnic Group | 16,299 |
| Literacy (A10+) (C 2011) | |
|---|---|
| yes | 682,520 |
| no | 51,633 |