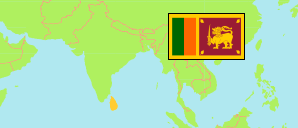
Gampaha
District in Sri Lanka
Contents: Population
The population development of Gampaha as well as related information and services (Wikipedia, Google, images).
| Name | Status | Population Census 1981-03-17 | Population Census 2001-07-17 | Population Census 2012-03-20 | Population Estimate 2021-07-01 | |
|---|---|---|---|---|---|---|
| Gampaha | District | 1,390,862 | 2,063,684 | 2,304,833 | 2,443,000 | |
| Sri Lanka | Republic | 14,846,750 | 18,797,257 | 20,359,439 | 22,156,000 |
Source: Department of Census and Statistics, Sri Lanka (web).
Explanation: The 2021 estimates are provisional.
Further information about the population structure:
| Gender (E 2021) | |
|---|---|
| Males | 1,184,000 |
| Females | 1,259,000 |
| Urbanization (C 2012) | |
|---|---|
| Rural | 1,943,418 |
| Urban | 360,221 |
| Estate | 1,194 |
| Age Groups (C 2012) | |
|---|---|
| 0-14 years | 525,571 |
| 15-64 years | 1,589,759 |
| 65+ years | 189,503 |
| Age Distribution (C 2012) | |
|---|---|
| 0-9 years | 355,220 |
| 10-19 years | 348,918 |
| 20-29 years | 364,549 |
| 30-39 years | 367,251 |
| 40-49 years | 313,101 |
| 50-59 years | 259,940 |
| 60-69 years | 182,182 |
| 70-79 years | 80,332 |
| 80+ years | 33,340 |
| Ethnic Group (C 2012) | |
|---|---|
| Sinhalese | 2,086,469 |
| Tamil | 90,382 |
| Sri Lankan Moor | 97,621 |
| Other ethnic group | 30,361 |
| Religion (C 2012) | |
|---|---|
| Buddhist | 1,642,767 |
| Hindu | 52,973 |
| Muslim | 112,746 |
| Christian | 495,478 |
| Other religion | 869 |
| Place of Birth (C 2012) | |
|---|---|
| in the same district | 1,708,361 |
| elsewhere | 596,472 |