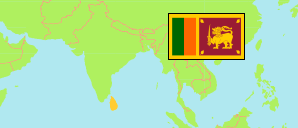
Colombo
District in Sri Lanka
Contents: Population
The population development of Colombo as well as related information and services (Wikipedia, Google, images).
| Name | Status | Population Census 1981-03-17 | Population Census 2001-07-17 | Population Census 2012-03-20 | Population Estimate 2021-07-01 | |
|---|---|---|---|---|---|---|
| Colombo | District | 1,699,241 | 2,251,274 | 2,324,349 | 2,480,000 | |
| Sri Lanka | Republic | 14,846,750 | 18,797,257 | 20,359,439 | 22,156,000 |
Source: Department of Census and Statistics, Sri Lanka (web).
Explanation: The 2021 estimates are provisional.
Further information about the population structure:
| Gender (E 2021) | |
|---|---|
| Males | 1,217,000 |
| Females | 1,263,000 |
| Urbanization (C 2012) | |
|---|---|
| Rural | 513,534 |
| Urban | 1,802,904 |
| Estate | 7,911 |
| Age Groups (C 2012) | |
|---|---|
| 0-14 years | 503,904 |
| 15-64 years | 1,614,982 |
| 65+ years | 205,463 |
| Age Distribution (C 2012) | |
|---|---|
| 0-9 years | 339,498 |
| 10-19 years | 340,253 |
| 20-29 years | 380,707 |
| 30-39 years | 362,784 |
| 40-49 years | 317,566 |
| 50-59 years | 267,597 |
| 60-69 years | 192,152 |
| 70-79 years | 87,211 |
| 80+ years | 36,581 |
| Ethnic Group (C 2012) | |
|---|---|
| Sinhalese | 1,778,971 |
| Tamil | 259,379 |
| Sri Lankan Moor | 249,609 |
| Other ethnic group | 36,390 |
| Religion (C 2012) | |
|---|---|
| Buddhist | 1,632,225 |
| Hindu | 186,454 |
| Muslim | 274,087 |
| Christian | 229,308 |
| Other religion | 2,275 |
| Place of Birth (C 2012) | |
|---|---|
| in the same district | 1,708,791 |
| elsewhere | 615,558 |