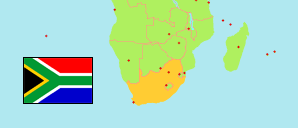
Northern Cape
Province in South Africa
Contents: Subdivision
The population development in Northern Cape as well as related information and services (Wikipedia, Google, images).
| Name | Status | Population Census 1996-10-09 | Population Census 2001-10-09 | Population Census 2011-10-09 | Population Census 2022-02-02 | |
|---|---|---|---|---|---|---|
| Northern Cape | Province | 1,011,864 | 991,876 | 1,145,861 | 1,355,945 | |
| Dawid Kruiper (incl. Khara Hais, Mier) | Local Municipality | 88,249 | 85,126 | 100,498 | 125,744 | → |
| Dikgatlong | Local Municipality | 39,527 | 38,262 | 46,841 | 56,967 | → |
| Emthanjeni | Local Municipality | 39,363 | 35,785 | 42,356 | 46,587 | → |
| Gamagara | Local Municipality | 22,219 | 23,202 | 41,617 | 29,580 | → |
| Ga-Segonyana | Local Municipality | 61,967 | 70,392 | 93,651 | 117,454 | → |
| Hantam | Local Municipality | 20,101 | 20,351 | 21,671 | 22,281 | → |
| Joe Morolong (Moshaweng) | Local Municipality | 112,435 | 97,902 | 89,530 | 125,420 | → |
| Kai !Garib | Local Municipality | 57,730 | 58,671 | 65,869 | 85,104 | → |
| Kamiesberg | Local Municipality | 11,064 | 10,760 | 10,187 | 15,130 | → |
| Kareeberg | Local Municipality | 11,474 | 9,488 | 11,673 | 10,961 | → |
| Karoo Hoogland | Local Municipality | 12,228 | 10,512 | 12,514 | 11,691 | → |
| Kgatelopele | Local Municipality | 16,113 | 14,743 | 18,687 | 19,854 | → |
| Khâi-Ma | Local Municipality | 9,550 | 11,463 | 12,446 | 8,510 | → |
| !Kheis | Local Municipality | 15,046 | 16,538 | 16,637 | 21,954 | → |
| Magareng | Local Municipality | 22,457 | 21,733 | 24,204 | 26,816 | → |
| Nama Khoi | Local Municipality | 43,841 | 44,900 | 47,041 | 67,089 | → |
| Phokwane | Local Municipality | 57,591 | 61,321 | 63,000 | 80,481 | → |
| Renosterberg | Local Municipality | 9,432 | 9,070 | 10,978 | 10,843 | → |
| Richtersveld | Local Municipality | 12,819 | 10,125 | 11,982 | 24,235 | → |
| Siyancuma | Local Municipality | 38,546 | 39,275 | 37,076 | 53,165 | → |
| Siyathemba | Local Municipality | 20,156 | 18,445 | 21,591 | 27,102 | → |
| Sol Plaatje | Local Municipality | 205,103 | 202,246 | 248,041 | 270,078 | → |
| Thembelihle | Local Municipality | 13,438 | 14,467 | 15,701 | 22,542 | → |
| Tsantsabane | Local Municipality | 26,344 | 27,082 | 35,093 | 30,969 | → |
| Ubuntu | Local Municipality | 19,705 | 16,375 | 18,601 | 15,836 | → |
| Umsobomvu | Local Municipality | 25,367 | 23,641 | 28,376 | 29,555 | → |
| South Africa | Republic | 40,583,573 | 44,819,778 | 51,770,560 | 62,027,503 |
Source: Statistics South Africa.
Explanation: Area figures for municipalities are calculated from geospatial data.
Further information about the population structure:
| Gender (C 2022) | |
|---|---|
| Males | 653,320 |
| Females | 702,626 |
| Age Groups (C 2022) | |
|---|---|
| 0-14 years | 377,333 |
| 15-64 years | 888,823 |
| 65+ years | 89,706 |
| Age Distribution (C 2022) | |
|---|---|
| 80+ years | 13,872 |
| 70-79 years | 38,476 |
| 60-69 years | 86,886 |
| 50-59 years | 127,895 |
| 40-49 years | 160,963 |
| 30-39 years | 200,371 |
| 20-29 years | 224,876 |
| 10-19 years | 251,034 |
| 0-9 years | 251,489 |
| Population Group (C 2022) | |
|---|---|
| Black African | 679,383 |
| White | 99,150 |
| Asian | 10,824 |
| Coloured | 563,605 |
| Other group | 2,667 |