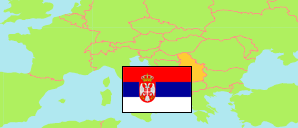
Zlatibor
District in Serbia
Contents: Subdivision
The population development in Zlatibor as well as related information and services (Wikipedia, Google, images).
| Name | Status | Native | Population Census 1991-03-31 | Population Census 2002-04-01 | Population Census 2011-09-30 | Population Census 2022-09-30 | |
|---|---|---|---|---|---|---|---|
| Zlatibor | District | Златиборска област | 332,470 | 313,396 | 286,549 | 254,659 | |
| Arilje | Municipality | Ариље | 20,107 | 19,784 | 18,792 | 17,063 | → |
| Bajina Bašta | Municipality | Бајина Башта | 29,225 | 29,151 | 26,022 | 23,533 | → |
| Čajetina | Municipality | Чајетина | 15,914 | 15,628 | 14,745 | 14,585 | → |
| Kosjerić | Municipality | Косјерић | 15,236 | 14,001 | 12,090 | 10,175 | → |
| Nova Varoš | Municipality | Нова Варош | 21,756 | 19,982 | 16,638 | 13,507 | → |
| Požega | Municipality | Пожега | 33,289 | 32,293 | 29,638 | 25,988 | → |
| Priboj | Municipality | Прибој | 35,487 | 30,377 | 27,133 | 23,514 | → |
| Prijepolje | Municipality | Пријепоље | 46,085 | 41,188 | 37,059 | 32,214 | → |
| Sevojno | City Municipality | Севојно | 6,485 | 7,445 | 7,101 | 6,426 | → |
| Sjenica | Municipality | Сјеница | 33,068 | 27,970 | 26,392 | 24,083 | → |
| Užice | City Municipality | Ужице | 75,818 | 75,577 | 70,939 | 63,571 | → |
| Srbija [Serbia] | Republik | Србија | 7,576,837 | 7,498,001 | 7,186,862 | 6,647,003 |
Source: Statistical Office of the Republic of Serbia (web).
Explanation: The 2011 census was affected by the boycott of the Albanians in the municipalities Preševo and Bujanovac (both located in the District of Pčinja) and partly affected in Medveđa (District of Jablanica).
Further information about the population structure:
| Gender (C 2022) | |
|---|---|
| Males | 126,267 |
| Females | 128,392 |
| Age Groups (C 2022) | |
|---|---|
| 0-17 years | 43,425 |
| 18-64 years | 151,465 |
| 65+ years | 59,769 |
| Age Distribution (C 2022) | |
|---|---|
| 80+ years | 11,868 |
| 70-79 years | 26,835 |
| 60-69 years | 41,503 |
| 50-59 years | 37,422 |
| 40-49 years | 33,276 |
| 30-39 years | 29,844 |
| 20-29 years | 25,081 |
| 10-19 years | 25,933 |
| 0-9 years | 22,897 |
| Urbanization (C 2022) | |
|---|---|
| Rural | 118,666 |
| Urban | 135,993 |
| Ethnic Group (C 2022) | |
|---|---|
| Serbs | 200,254 |
| Hungarians | 42 |
| Bosniaks | 35,346 |
| Roma | 588 |
| Albanians | 70 |
| Slovaks | 8 |
| Croats | 102 |
| Other group | 5,488 |