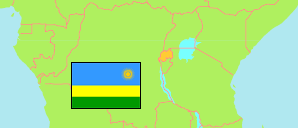
Kinyinya
Sector in Rwanda
Contents: Population
The population development of Kinyinya as well as related information and services (Wikipedia, Google, images).
| Name | Status | Population Census 2012-08-15 | Population Census 2022-08-15 | |
|---|---|---|---|---|
| Kinyinya | Sector | 57,846 | 125,400 | |
| Rwanda | Republic | 10,515,973 | 13,246,394 |
Source: National Institute of Statistics Rwanda.
Further information about the population structure:
| Gender (C 2022) | |
|---|---|
| Males | 63,081 |
| Females | 62,319 |
| Age Groups (C 2022) | |
|---|---|
| 0-14 years | 43,817 |
| 15-64 years | 80,248 |
| 65+ years | 1,335 |
| Age Distribution (C 2022) | |
|---|---|
| 80+ years | 263 |
| 70-79 years | 512 |
| 60-69 years | 1,563 |
| 50-59 years | 3,856 |
| 40-49 years | 11,356 |
| 30-39 years | 25,727 |
| 20-29 years | 27,137 |
| 10-19 years | 21,908 |
| 0-9 years | 33,078 |
| Urbanization (C 2022) | |
|---|---|
| Urban | 125,400 |