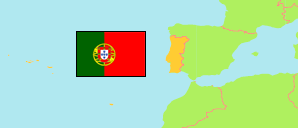
Portalegre
Municipality in Portalegre District
Contents: Subdivision
The population development in Portalegre as well as related information and services (Wikipedia, Google, images).
| Name | Status | Population Census 2001-03-12 | Population Census 2011-03-21 | Population Census 2021-03-22 | |
|---|---|---|---|---|---|
| Portalegre | Municipality | 25,980 | 24,930 | 22,340 | |
| Alagoa | Parish | 715 | 669 | 543 | → |
| Alegrete | Parish | 2,055 | 1,746 | 1,414 | → |
| Fortios | Parish | 2,021 | 2,018 | 1,785 | → |
| Reguengo e São Julião | Parish | 1,156 | 972 | 849 | → |
| Ribeira de Nisa e Carreiras | Parish | 2,148 | 1,949 | 1,731 | → |
| Sé e São Lourenço | Parish | 15,768 | 15,642 | 14,317 | → |
| Urra | Parish | 2,117 | 1,934 | 1,701 | → |
| Portalegre | District | 127,018 | 118,506 | 104,923 |
Source: Instituto Nacional de Estatística Portugal (web).
Further information about the population structure:
| Gender (C 2021) | |
|---|---|
| Males | 10,592 |
| Females | 11,748 |
| Age Groups (C 2021) | |
|---|---|
| 0-14 years | 2,733 |
| 15-64 years | 13,479 |
| 65+ years | 6,128 |
| Age Distribution (C 2021) | |
|---|---|
| 80+ years | 2,005 |
| 70-79 years | 2,549 |
| 60-69 years | 3,260 |
| 50-59 years | 3,184 |
| 40-49 years | 3,278 |
| 30-39 years | 2,246 |
| 20-29 years | 1,981 |
| 10-19 years | 2,113 |
| 0-9 years | 1,724 |
| Citizenship (C 2021) | |
|---|---|
| Portugal | 21,927 |
| EU | 87 |
| Europe (other) | 33 |
| Africa | 108 |
| America | 141 |
| Asia & Oceania | 44 |
| Country of Birth (C 2021) | |
|---|---|
| Portugal | 21,470 |
| EU | 200 |
| Europe (other) | 64 |
| Africa | 347 |
| America | 205 |
| Asia & Oceania | 54 |