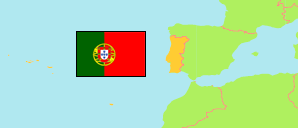
Peniche
Municipality in Leiria District
Contents: Subdivision
The population development in Peniche as well as related information and services (Wikipedia, Google, images).
| Name | Status | Population Census 2001-03-12 | Population Census 2011-03-21 | Population Census 2021-03-22 | |
|---|---|---|---|---|---|
| Peniche | Municipality | 27,315 | 27,753 | 26,429 | |
| Atouguia da Baleia | Parish | 7,988 | 8,954 | 9,117 | → |
| Ferrel | Parish | 2,355 | 2,649 | 2,759 | → |
| Peniche | Parish | 15,595 | 14,749 | 13,211 | → |
| Serra d'El-Rei | Parish | 1,377 | 1,401 | 1,342 | → |
| Leiria | District | 459,426 | 470,922 | 458,605 |
Source: Instituto Nacional de Estatística Portugal (web).
Further information about the population structure:
| Gender (C 2021) | |
|---|---|
| Males | 12,689 |
| Females | 13,740 |
| Age Groups (C 2021) | |
|---|---|
| 0-14 years | 3,525 |
| 15-64 years | 16,014 |
| 65+ years | 6,890 |
| Age Distribution (C 2021) | |
|---|---|
| 80+ years | 1,829 |
| 70-79 years | 3,126 |
| 60-69 years | 3,800 |
| 50-59 years | 3,669 |
| 40-49 years | 3,817 |
| 30-39 years | 2,886 |
| 20-29 years | 2,448 |
| 10-19 years | 2,623 |
| 0-9 years | 2,231 |
| Citizenship (C 2021) | |
|---|---|
| Portugal | 25,343 |
| EU | 266 |
| Europe (other) | 180 |
| Africa | 132 |
| America | 422 |
| Asia & Oceania | 86 |
| Country of Birth (C 2021) | |
|---|---|
| Portugal | 24,223 |
| EU | 684 |
| Europe (other) | 299 |
| Africa | 481 |
| America | 646 |
| Asia & Oceania | 96 |