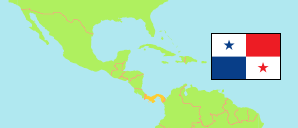
Panamá Oeste
Province in Panama
Contents: Subdivision
The population in Panamá Oeste as well as related information and services (Wikipedia, Google, images).
| Name | Status | Population Census 2023-01-08 | |
|---|---|---|---|
| Panamá Oeste [West Panama] | Province | 653,665 | |
| Amador | Township | 3,337 | → |
| Arosemena | Township | 586 | → |
| Arraiján | Township | 44,327 | → |
| Barrio Balboa | Township | 26,165 | → |
| Barrio Colón | Township | 39,273 | → |
| Bejuco | Township | 6,242 | → |
| Buenos Aires | Township | 2,288 | → |
| Burunga | Township | 51,167 | → |
| Cabuya | Township | 2,078 | → |
| Caimito | Township | 2,084 | → |
| Campana | Township | 2,268 | → |
| Capira | Township | 5,819 | → |
| Cermeño | Township | 2,274 | → |
| Cerro Silvestre | Township | 31,567 | → |
| Chame | Township | 2,544 | → |
| Chicá | Township | 882 | → |
| Cirí de Los Sotos | Township | 2,313 | → |
| Cirí Grande | Township | 4,593 | → |
| El Arado | Township | 6,242 | → |
| El Cacao | Township | 5,639 | → |
| El Coco | Township | 22,807 | → |
| El Espino | Township | 2,032 | → |
| El Higo | Township | 3,373 | → |
| El Líbano | Township | 299 | → |
| Feuillet | Township | 4,094 | → |
| Guadalupe | Township | 38,724 | → |
| Guayabito | Township | 605 | → |
| Herrera | Township | 23,424 | → |
| Hurtado | Township | 1,599 | → |
| Iturralde | Township | 1,516 | → |
| Juan Demóstenes Arosemena | Township | 66,474 | → |
| La Ermita | Township | 1,820 | → |
| La Laguna | Township | 1,359 | → |
| La Represa | Township | 936 | → |
| Las Lajas | Township | 3,893 | → |
| Las Ollas Arriba | Township | 1,550 | → |
| Las Uvas | Township | 1,942 | → |
| La Trinidad | Township | 2,991 | → |
| Lídice | Township | 6,315 | → |
| Los Díaz | Township | 1,750 | → |
| Los Llanitos | Township | 3,791 | → |
| Mendoza | Township | 1,517 | → |
| Nueva Gorgona | Township | 4,945 | → |
| Nuevo Emperador | Township | 10,414 | → |
| Obaldía | Township | 767 | → |
| Playa Leona | Township | 36,116 | → |
| Puerto Caimito | Township | 46,923 | → |
| Punta Chame | Township | 477 | → |
| Sajalices | Township | 3,004 | → |
| San Carlos | Township | 3,980 | → |
| San José | Township | 3,299 | → |
| Santa Clara | Township | 2,630 | → |
| Santa Rita | Township | 2,445 | → |
| Santa Rosa | Township | 2,166 | → |
| Sorá | Township | 1,883 | → |
| Vacamonte | Township | 46,597 | → |
| Veracruz | Township | 24,486 | → |
| Villa Carmen | Township | 1,697 | → |
| Villa Rosario | Township | 5,920 | → |
| Vista Alegre | Township | 21,417 | → |
| Panamá | Republic | 4,202,572 |
Source: Instituto Nacional de Estadística y Censo, Panamá.
Explanation: The tabulated census results are not adjusted for underenumeration. The 2023 total population includes 137,792 persons taken from administrative registers; they are not included in the province and township figures. Area figures of townships are computed using geospatial data.
Further information about the population structure:
| Gender (C 2023) | |
|---|---|
| Males | 322,729 |
| Females | 330,936 |
| Age Groups (C 2023) | |
|---|---|
| 0-14 years | 160,851 |
| 15-64 years | 438,788 |
| 65+ years | 54,025 |
| Age Distribution (C 2023) | |
|---|---|
| 90+ years | 2,139 |
| 80-89 years | 9,331 |
| 70-79 years | 23,721 |
| 60-69 years | 44,477 |
| 50-59 years | 70,797 |
| 40-49 years | 85,146 |
| 30-39 years | 102,158 |
| 20-29 years | 104,721 |
| 10-19 years | 105,378 |
| 0-9 years | 105,796 |
| Urbanization (C 2023) | |
|---|---|
| Rural | 111,295 |
| Urban | 542,370 |
| Ethnic Group (C 2023) | |
|---|---|
| Ngäbe | 13,869 |
| Guna | 32,262 |
| Other Indigenous | 16,398 |
| African, Not Indigenous | 221,948 |
| Not African, Not Indigenous | 369,168 |