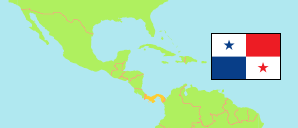
Panamá
Province in Panama
Contents: Subdivision
The population in Panamá as well as related information and services (Wikipedia, Google, images).
| Name | Status | Population Census 2023-01-08 | |
|---|---|---|---|
| Panamá | Province | 1,439,575 | |
| 24 de Diciembre | Township | 79,965 | → |
| Alcalde Díaz | Township | 46,976 | → |
| Amelia Denis de Icaza | Township | 29,208 | → |
| Ancón | Township | 37,224 | → |
| Arnulfo Arias | Township | 31,433 | → |
| Belisario Frías | Township | 33,072 | → |
| Belisario Porras | Township | 44,129 | → |
| Bella Vista | Township | 33,710 | → |
| Betania | Township | 42,199 | → |
| Brujas | Township | 614 | → |
| Caimitillo | Township | 34,097 | → |
| Cañita | Township | 2,764 | → |
| Chepillo | Township | 195 | → |
| Chepo | Township | 34,425 | → |
| Chilibre | Township | 49,582 | → |
| Chimán | Township | 1,013 | → |
| Curundú | Township | 15,458 | → |
| Don Bosco | Township | 49,906 | → |
| El Chorrillo | Township | 16,335 | → |
| El Llano | Township | 3,312 | → |
| Ernesto Córdoba Campos | Township | 71,613 | → |
| Gonzalo Vásquez | Township | 207 | → |
| José Domingo Espinar | Township | 44,448 | → |
| Juan Díaz | Township | 56,583 | → |
| La Ensenada | Township | 55 | → |
| La Esmeralda | Township | 570 | → |
| La Exposición (Calidonia) | Township | 17,300 | → |
| La Guinea | Township | 42 | → |
| Las Cumbres | Township | 39,923 | → |
| Las Garzas | Township | 56,980 | → |
| Las Mañanitas | Township | 45,241 | → |
| Las Margaritas | Township | 5,658 | → |
| Madungandí (Guna de Madungandí) | Indigenous Territory | 7,647 | → |
| Mateo Iturralde | Township | 9,638 | → |
| Omar Torrijos | Township | 32,403 | → |
| Otoque Occidente | Township | 167 | → |
| Otoque Oriente | Township | 188 | → |
| Pacora | Township | 70,283 | → |
| Parque Lefevre | Township | 42,832 | → |
| Pásiga | Township | 459 | → |
| Pedregal | Township | 57,682 | → |
| Pedro González | Township | 287 | → |
| Pueblo Nuevo | Township | 24,167 | → |
| Río Abajo | Township | 28,045 | → |
| Rufina Alfaro | Township | 41,265 | → |
| Saboga | Township | 297 | → |
| San Felipe | Township | 1,258 | → |
| San Francisco | Township | 61,290 | → |
| San Martín | Township | 5,485 | → |
| San Miguel | Township | 738 | → |
| Santa Ana | Township | 13,495 | → |
| Santa Cruz de Chinina | Township | 1,200 | → |
| Taboga | Township | 734 | → |
| Tocumen | Township | 89,361 | → |
| Tortí | Township | 10,387 | → |
| Unión Santeña | Township | 849 | → |
| Victoriano Lorenzo | Township | 15,181 | → |
| Panamá | Republic | 4,202,572 |
Source: Instituto Nacional de Estadística y Censo, Panamá.
Explanation: The tabulated census results are not adjusted for underenumeration. The 2023 total population includes 137,792 persons taken from administrative registers; they are not included in the province and township figures. Area figures of townships are computed using geospatial data.
Further information about the population structure:
| Gender (C 2023) | |
|---|---|
| Males | 704,358 |
| Females | 735,217 |
| Age Groups (C 2023) | |
|---|---|
| 0-14 years | 319,513 |
| 15-64 years | 977,496 |
| 65+ years | 142,277 |
| Age Distribution (C 2023) | |
|---|---|
| 90+ years | 6,140 |
| 80-89 years | 25,234 |
| 70-79 years | 63,321 |
| 60-69 years | 108,170 |
| 50-59 years | 162,971 |
| 40-49 years | 197,603 |
| 30-39 years | 221,476 |
| 20-29 years | 229,086 |
| 10-19 years | 217,699 |
| 0-9 years | 207,586 |
| Urbanization (C 2023) | |
|---|---|
| Rural | 87,474 |
| Urban | 1,352,101 |
| Ethnic Group (C 2023) | |
|---|---|
| Ngäbe | 34,376 |
| Guna | 35,897 |
| Other Indigenous | 52,722 |
| African, Not Indigenous | 500,458 |
| Not African, Not Indigenous | 815,212 |