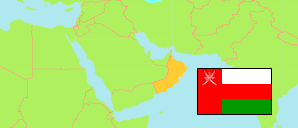
Ad-Dākhilīyah
Governorate in Oman
Contents: Subdivision
The population development in Ad-Dākhilīyah as well as related information and services (Wikipedia, Google, images).
| Name | Status | Native | Population Census 2003-12-07 | Population Census 2010-12-12 | Population Census 2020-12-12 | |
|---|---|---|---|---|---|---|
| Ad-Dākhilīyah [Ad Dakhiliyah] | Governorate | الداخلية | 267,140 | 326,651 | 478,501 | |
| Ādam | District | أدم | 16,871 | 27,321 | 28,163 | → |
| Al-Ḥamrā' | District | الحمراء | 17,221 | 19,509 | 28,228 | → |
| Bahlā' | District | بهلا | 51,278 | 58,234 | 88,286 | → |
| Bidbid | District | بدبد | 20,683 | 24,705 | 37,434 | → |
| Izkī | District | إزكي | 35,173 | 41,402 | 58,905 | → |
| Manaḥ | District | منح | 12,568 | 15,056 | 25,320 | → |
| Nizwā | District | نزوى | 68,785 | 84,528 | 131,763 | → |
| Samā'il | District | سمائل | 44,561 | 55,896 | 80,402 | → |
| ʻUmān [Oman] | Sultanate | عمان | 2,340,815 | 2,773,479 | 4,617,927 |
Source: Sultanate of Oman, National Centre for Statistics and Information (web).
Explanation: The 2020 census was organized as an electronic census.
Further information about the population structure:
| Gender (C 2020) | |
|---|---|
| Males | 276,856 |
| Females | 201,645 |
| Age Groups (C 2020) | |
|---|---|
| 0-14 years | 151,192 |
| 15-64 years | 313,658 |
| 65+ years | 13,651 |
| Age Distribution (C 2020) | |
|---|---|
| 0-9 years | 110,239 |
| 10-19 years | 73,996 |
| 20-29 years | 90,569 |
| 30-39 years | 103,568 |
| 40-49 years | 55,635 |
| 50-59 years | 23,542 |
| 60-69 years | 11,970 |
| 70-79 years | 6,233 |
| 80+ years | 2,749 |
| Citizenship (C 2020) | |
|---|---|
| Omani | 363,857 |
| Foreign Citizenship | 114,644 |