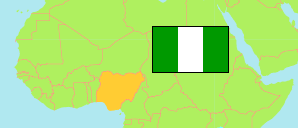
Bauchi
State in Nigeria
Contents: Subdivision
The population development in Bauchi as well as related information and services (Wikipedia, Google, images).
| Name | Status | Population Census 1991-11-26 | Population Census 2006-03-21 | Population Projection 2022-03-21 | |
|---|---|---|---|---|---|
| Bauchi | State | 2,861,887 | 4,653,066 | 8,308,800 | |
| Alkaleri | Local Government Area | 257,871 | 328,284 | 586,200 | → |
| Bauchi | Local Government Area | 356,923 | 493,730 | 881,600 | → |
| Bogoro | Local Government Area | ... | 83,809 | 149,700 | → |
| Damban | Local Government Area | ... | 150,212 | 268,200 | → |
| Darazo | Local Government Area | 163,831 | 249,946 | 446,300 | → |
| Dass | Local Government Area | 50,281 | 90,114 | 160,900 | → |
| Gamawa | Local Government Area | ... | 284,411 | 507,900 | → |
| Ganjuwa | Local Government Area | 144,758 | 278,471 | 497,300 | → |
| Giade | Local Government Area | ... | 156,022 | 278,600 | → |
| Itas/Gadau | Local Government Area | 135,707 | 228,527 | 408,100 | → |
| Jama'are | Local Government Area | 70,436 | 117,482 | 209,800 | → |
| Katagum | Local Government Area | 195,066 | 293,020 | 523,200 | → |
| Kirfi | Local Government Area | ... | 145,636 | 260,100 | → |
| Misau | Local Government Area | ... | 261,410 | 466,800 | → |
| Ningi | Local Government Area | 279,993 | 385,997 | 689,300 | → |
| Shira | Local Government Area | ... | 233,999 | 417,800 | → |
| Tafawa-Balewa | Local Government Area | ... | 221,310 | 395,200 | → |
| Toro | Local Government Area | 209,253 | 346,000 | 617,800 | → |
| Warji | Local Government Area | ... | 114,983 | 205,300 | → |
| Zaki | Local Government Area | ... | 189,703 | 338,700 | → |
| Nigeria | Federal Republic | 88,992,220 | 140,431,790 | 216,783,400 |
Source: National Population Commission of Nigeria (web), National Bureau of Statistics (web).
Explanation: The population projection assumes the same rate of growth for all LGAs within a state. The undercount of the 1991 census is estimated to be about 25 million. All population figures for Nigeria show high error rates; census results are disputed. Area figures are computed using geospatial data.
Further information about the population structure:
| Gender (C 2006) | |
|---|---|
| Males | 2,369,266 |
| Females | 2,283,800 |
| Age Groups (C 2006) | |
|---|---|
| 0-14 years | 2,230,235 |
| 15-64 years | 2,293,240 |
| 65+ years | 129,591 |
| Age Distribution (C 2006) | |
|---|---|
| 0-9 years | 1,686,117 |
| 10-19 years | 1,020,487 |
| 20-29 years | 766,226 |
| 30-39 years | 499,140 |
| 40-49 years | 309,554 |
| 50-59 years | 172,695 |
| 60-69 years | 95,401 |
| 70-79 years | 56,532 |
| 80+ years | 46,914 |