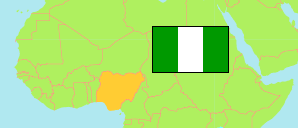
Akwa Ibom
State in Nigeria
Contents: Subdivision
The population development in Akwa Ibom as well as related information and services (Wikipedia, Google, images).
| Name | Status | Population Census 1991-11-26 | Population Census 2006-03-21 | Population Projection 2022-03-21 | |
|---|---|---|---|---|---|
| Akwa Ibom | State | 2,409,613 | 3,902,051 | 4,979,400 | |
| Abak | Local Government Area | 108,833 | 139,069 | 177,500 | → |
| Eastern Obolo | Local Government Area | ... | 59,970 | 76,500 | → |
| Eket | Local Government Area | 82,610 | 172,856 | 220,600 | → |
| Esit Eket | Local Government Area | ... | 63,358 | 80,900 | → |
| Essien Udim | Local Government Area | 130,215 | 193,257 | 246,600 | → |
| Etim Ekpo | Local Government Area | ... | 105,922 | 135,200 | → |
| Etinan | Local Government Area | 90,085 | 168,924 | 215,600 | → |
| Ibeno | Local Government Area | ... | 74,840 | 95,500 | → |
| Ibesikpo Asutan | Local Government Area | ... | 137,127 | 175,000 | → |
| Ibiono Ibom | Local Government Area | ... | 188,605 | 240,700 | → |
| Ika | Local Government Area | ... | 72,772 | 92,900 | → |
| Ikono | Local Government Area | 92,521 | 131,673 | 168,000 | → |
| Ikot Abasi | Local Government Area | 80,071 | 132,608 | 169,200 | → |
| Ikot Ekpene | Local Government Area | ... | 141,408 | 180,500 | → |
| Ini | Local Government Area | 71,292 | 99,084 | 126,400 | → |
| Itu | Local Government Area | ... | 127,856 | 163,200 | → |
| Mbo | Local Government Area | 67,302 | 102,173 | 130,400 | → |
| Mkpat Enin | Local Government Area | 104,127 | 177,293 | 226,200 | → |
| Nsit Atai | Local Government Area | ... | 73,395 | 93,700 | → |
| Nsit Ibom | Local Government Area | ... | 108,095 | 137,900 | → |
| Nsit Ubium | Local Government Area | 73,826 | 127,083 | 162,200 | → |
| Obot Akara | Local Government Area | ... | 147,286 | 188,000 | → |
| Okobo | Local Government Area | 69,433 | 102,753 | 131,100 | → |
| Onna | Local Government Area | 113,048 | 123,193 | 157,200 | → |
| Oron | Local Government Area | ... | 87,209 | 111,300 | → |
| Oruk Anam | Local Government Area | 126,726 | 171,839 | 219,300 | → |
| Udung Uko | Local Government Area | ... | 53,060 | 67,700 | → |
| Ukanafun | Local Government Area | 85,944 | 125,473 | 160,100 | → |
| Uruan | Local Government Area | 79,908 | 117,169 | 149,500 | → |
| Urue-Offong/Oruko | Local Government Area | 30,734 | 70,740 | 90,300 | → |
| Uyo | Local Government Area | 244,762 | 305,961 | 390,400 | → |
| Nigeria | Federal Republic | 88,992,220 | 140,431,790 | 216,783,400 |
Source: National Population Commission of Nigeria (web), National Bureau of Statistics (web).
Explanation: The population projection assumes the same rate of growth for all LGAs within a state. The undercount of the 1991 census is estimated to be about 25 million. All population figures for Nigeria show high error rates; census results are disputed. Area figures are computed using geospatial data.
Further information about the population structure:
| Gender (C 2006) | |
|---|---|
| Males | 1,983,202 |
| Females | 1,918,849 |
| Age Groups (C 2006) | |
|---|---|
| 0-14 years | 1,456,920 |
| 15-64 years | 2,318,155 |
| 65+ years | 126,976 |
| Age Distribution (C 2006) | |
|---|---|
| 0-9 years | 986,820 |
| 10-19 years | 928,914 |
| 20-29 years | 725,791 |
| 30-39 years | 483,444 |
| 40-49 years | 356,055 |
| 50-59 years | 208,159 |
| 60-69 years | 127,809 |
| 70-79 years | 54,358 |
| 80+ years | 30,701 |