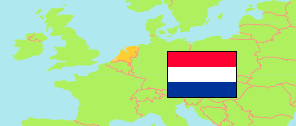
Ede
Municipality in Gelderland (Netherlands)
Contents: Population
The population development of Ede as well as related information and services (Wikipedia, Google, images).
| Name | Status | Population Census 2001-01-01 | Population Estimate 2008-01-01 | Population Estimate 2011-01-01 | Population Estimate 2018-01-01 | Population Estimate 2024-01-01 | |
|---|---|---|---|---|---|---|---|
| Ede | Municipality | 102,401 | 107,686 | 108,285 | 114,682 | 123,489 | |
| Nederland [Netherlands] | Country | 15,985,538 | 16,405,399 | 16,655,799 | 17,181,084 | 17,947,684 |
Source: Statistics Netherlands.
Explanation: Provinces and municipalities in the boundaries of 1 January 2024. 2024 population figures are preliminary.
Further information about the population structure:
| Gender (E 2023) | |
|---|---|
| Males | 60,626 |
| Females | 61,386 |
| Age Groups (E 2023) | |
|---|---|
| 0-17 years | 26,206 |
| 18-64 years | 72,600 |
| 65+ years | 23,206 |
| Age Distribution (E 2023) | |
|---|---|
| 90+ years | 975 |
| 80-89 years | 4,834 |
| 70-79 years | 10,568 |
| 60-69 years | 14,399 |
| 50-59 years | 16,167 |
| 40-49 years | 13,850 |
| 30-39 years | 15,802 |
| 20-29 years | 15,939 |
| 10-19 years | 14,983 |
| 0-9 years | 14,495 |
| Urbanization (E 2023) | |
|---|---|
| Highly urbanized | 24,950 |
| Strongly urbanized | 38,300 |
| Moderately urbanized | 20,100 |
| Lowly urbanized | 15,330 |
| Rural | 23,330 |
| Citizenhip (E 2023) | |
|---|---|
| Netherlands | 116,670 |
| European Union | 2,215 |
| Europe (Rest) | 669 |
| Other country | 2,458 |
| Birth Country (E 2023) | |
|---|---|
| Netherlands | 110,123 |
| Other country | 11,889 |