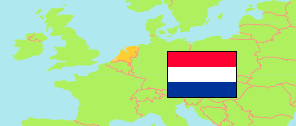
Flevoland
Province in Netherlands
Contents: Subdivision
The population development in Flevoland as well as related information and services (Wikipedia, Google, images).
| Name | Status | Population Census 2001-01-01 | Population Estimate 2008-01-01 | Population Estimate 2011-01-01 | Population Estimate 2018-01-01 | Population Estimate 2024-01-01 | |
|---|---|---|---|---|---|---|---|
| Flevoland | Province | 328,877 | 378,688 | 391,967 | 411,670 | 450,920 | |
| Almere | Municipality | 150,359 | 183,270 | 190,655 | 203,990 | 226,630 | → |
| Dronten | Municipality | 35,575 | 38,528 | 40,164 | 40,735 | 44,337 | → |
| Lelystad | Municipality | 64,665 | 73,063 | 75,111 | 77,389 | 84,091 | → |
| Noordoostpolder | Municipality | 43,668 | 45,716 | 46,253 | 46,625 | 50,050 | → |
| Urk | Municipality | 16,231 | 17,825 | 18,678 | 20,524 | 21,929 | → |
| Zeewolde | Municipality | 18,379 | 20,286 | 21,106 | 22,407 | 23,883 | → |
| Nederland [Netherlands] | Country | 15,985,538 | 16,405,399 | 16,655,799 | 17,181,084 | 17,947,684 |
Source: Statistics Netherlands.
Explanation: Provinces and municipalities in the boundaries of 1 January 2024. 2024 population figures are preliminary.
Further information about the population structure:
| Gender (E 2023) | |
|---|---|
| Males | 222,403 |
| Females | 222,298 |
| Age Groups (E 2023) | |
|---|---|
| 0-17 years | 97,778 |
| 18-64 years | 279,375 |
| 65+ years | 67,548 |
| Age Distribution (E 2023) | |
|---|---|
| 90+ years | 1,771 |
| 80-89 years | 10,623 |
| 70-79 years | 31,698 |
| 60-69 years | 51,641 |
| 50-59 years | 62,746 |
| 40-49 years | 56,428 |
| 30-39 years | 64,554 |
| 20-29 years | 56,026 |
| 10-19 years | 56,151 |
| 0-9 years | 53,063 |
| Urbanization (E 2023) | |
|---|---|
| Highly urbanized | 12,220 |
| Strongly urbanized | 175,880 |
| Moderately urbanized | 113,350 |
| Lowly urbanized | 86,170 |
| Rural | 57,070 |
| Citizenhip (E 2023) | |
|---|---|
| Netherlands | 402,796 |
| European Union | 18,576 |
| Europe (Rest) | 4,486 |
| Other country | 18,843 |
| Birth Country (E 2023) | |
|---|---|
| Netherlands | 353,813 |
| Other country | 90,888 |