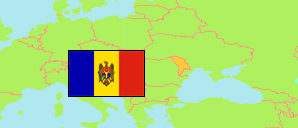
Chișinău
Municipality in Moldova
Contents: Subdivision
The population development in Chișinău as well as related information and services (Wikipedia, Google, images).
| Name | Status | Population Census 1989-01-12 | Population Census 2004-10-05 | Population Census 2014-05-12 | |
|---|---|---|---|---|---|
| Chișinău | Municipality | 770,948 | 712,218 | 662,836 | |
| Băcioi | Commune | ... | 10,618 | 10,175 | → |
| Bubuieci | Commune | ... | 6,748 | 8,047 | → |
| Budești | Commune-level Village | ... | 5,036 | 4,928 | → |
| Chișinău | City | 667,082 | 589,446 | 532,513 | → |
| Ciorescu | Commune | ... | 7,096 | 5,961 | → |
| Codru | City | 11,716 | 14,277 | 15,934 | → |
| Colonița | Commune-level Village | ... | 3,340 | 3,367 | → |
| Condrița | Commune-level Village | ... | 658 | 595 | → |
| Cricova | City | 7,164 | 9,878 | 10,669 | → |
| Cruzești | Commune | ... | 1,655 | 1,815 | → |
| Durlești | City | 17,807 | 15,394 | 17,210 | → |
| Ghidighici | Commune-level Village | ... | 5,094 | 5,051 | → |
| Grătiești | Commune | ... | 6,242 | 6,183 | → |
| Sîngera | City with Environs | ... | 11,609 | 9,966 | → |
| Stăuceni | Commune | ... | 6,833 | 8,694 | → |
| Tohatin | Commune | ... | 2,487 | 2,596 | → |
| Trușeni | Commune | ... | 7,952 | 10,380 | → |
| Vadul lui Vodă | City with Environs | ... | 4,559 | 5,295 | → |
| Vatra | City | 3,676 | 3,296 | 3,457 | → |
| Moldova [w/o Transnistria] | Republic | 3,657,665 | 3,383,332 | 2,998,235 |
Source: Departamentul Statistica si Sociologie al Republicii Moldova (web).
Explanation: The 2014 figures are adjusted for underenumeration. Furthermore, they include 209,030 persons absent from Moldova for more than 12 months. Area figures of communes are computed using geospatial data.
Further information about the population structure:
| Gender (C 2014) | |
|---|---|
| Males | 220,971 |
| Females | 248,431 |
| Age Groups (C 2014) | |
|---|---|
| 0-14 years | 74,687 |
| 15-64 years | 351,034 |
| 65+ years | 43,681 |
| Age Distribution (C 2014) | |
|---|---|
| 0-9 years | 55,767 |
| 10-19 years | 47,063 |
| 20-29 years | 92,759 |
| 30-39 years | 78,824 |
| 40-49 years | 58,096 |
| 50-59 years | 63,935 |
| 60-69 years | 45,263 |
| 70-79 years | 20,469 |
| 80+ years | 7,226 |
| Urbanization (C 2014) | |
|---|---|
| Rural | 72,205 |
| Urban | 397,197 |
| Country of Birth (C 2014) | |
|---|---|
| Moldova | 433,401 |
| EU | 2,518 |
| CIS | 32,070 |
| Other country | 1,184 |
| Ethnic Group (C 2014) | |
|---|---|
| Moldovans | 304,860 |
| Romanians | 65,605 |
| Ukrainians | 26,991 |
| Russians | 42,174 |
| Gagauzians | 3,108 |
| Bulgarians | 4,850 |
| Romani | 256 |
| Other ethnic groups | 5,954 |
| Native Language (C 2014) | |
|---|---|
| Moldovan | 148,447 |
| Romanian | 195,555 |
| Ukrainian | 7,554 |
| Russian | 93,435 |
| Gagauzian | 1,437 |
| Bulgarian | 1,851 |
| Romani | 153 |
| Other language | 1,835 |
| Religion (C 2014) | |
|---|---|
| Orthodox | 405,555 |
| Other religion | 12,634 |
| No religion | 4,108 |