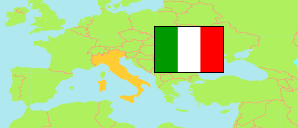
Campania
Region in Italy
Contents: Subdivision
The population development in Campania as well as related information and services (Wikipedia, Google, images).
| Name | Status | Population Census 1981-10-25 | Population Census 1991-10-20 | Population Census 2001-10-21 | Population Census 2011-10-09 | Population Estimate 2022-01-01 | Population Estimate 2024-01-01 | |
|---|---|---|---|---|---|---|---|---|
| Campania | Region | 5,463,134 | 5,630,280 | 5,701,931 | 5,766,810 | 5,624,420 | 5,590,076 | |
| Avellino | Province | 434,021 | 438,812 | 429,178 | 429,157 | 401,451 | 397,010 | → |
| Benevento | Province | 289,143 | 293,026 | 287,042 | 284,900 | 265,055 | 261,431 | → |
| Caserta | Province | 755,628 | 815,815 | 852,872 | 904,921 | 905,045 | 906,080 | → |
| Napoli [Naples] | Metropolitan City | 2,970,563 | 3,016,026 | 3,059,196 | 3,054,956 | 2,988,376 | 2,967,736 | → |
| Salerno | Province | 1,013,779 | 1,066,601 | 1,073,643 | 1,092,876 | 1,064,493 | 1,057,819 | → |
| Italia [Italy] | Republic | 56,556,911 | 56,778,031 | 56,995,744 | 59,433,744 | 59,030,133 | 58,989,749 |
Source: Istituto Nazionale di Statistica Italia.
Explanation: The tabulated population estimates are result of a sampling survey combined with an evaluation of registers. The 2024 figures are preliminary.
Further information about the population structure:
| Gender (E 2024) | |
|---|---|
| Males | 2,731,509 |
| Females | 2,858,567 |
| Age Groups (E 2024) | |
|---|---|
| 0-17 years | 939,679 |
| 18-64 years | 3,480,921 |
| 65+ years | 1,169,476 |
| Age Distribution (E 2024) | |
|---|---|
| 90+ years | 54,227 |
| 80-89 years | 260,713 |
| 70-79 years | 519,606 |
| 60-69 years | 729,509 |
| 50-59 years | 870,141 |
| 40-49 years | 770,245 |
| 30-39 years | 675,399 |
| 20-29 years | 642,400 |
| 10-19 years | 594,546 |
| 0-9 years | 473,290 |
| Citizenship (E 2024) | |
|---|---|
| Italy | 5,324,592 |
| Foreign Citizenship | 265,484 |