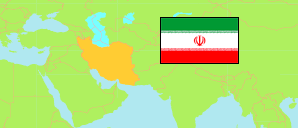
Eṣfahān
Province in Iran
Contents: Subdivision
The population development in Eṣfahān as well as related information and services (Wikipedia, Google, images).
| Name | Status | Native | Population Census 2011-10-24 | Population Census 2016-09-24 | |
|---|---|---|---|---|---|
| Eṣfahān [Isfahan] | Province | اصفهان | 4,879,312 | 5,120,850 | |
| Ārān va Bīdgol | County | شهرستان آران وبیدگل | 97,409 | 103,517 | → |
| Ardestān | County | شهرستان اردستان | 41,405 | 42,105 | → |
| Barkhār | County | شهرستان برخوار | 108,933 | 122,419 | → |
| Bū'īn va Mīāndasht [← Farīdan] | County | شهرستان بوئین ومیاندشت | 26,137 | 24,163 | → |
| Chādegān | County | شهرستان چادگان | 33,942 | 32,479 | → |
| Dehāqān | County | شهرستان دهاقان | 34,844 | 34,511 | → |
| Eṣfahān [Isfahan] | County | شهرستان اصفهان | 2,174,172 | 2,243,249 | → |
| Falāvarjān | County | شهرستان فلاورجان | 247,014 | 249,814 | → |
| Farīdan | County | شهرستان فریدن | 53,606 | 49,890 | → |
| Fereydūnshahr | County | شهرستان فریدون شهر | 38,334 | 35,654 | → |
| Golpāyegān | County | شهرستان گلپایگان | 87,479 | 90,086 | → |
| Kāshān | County | شهرستان کاشان | 323,371 | 364,482 | → |
| Khomeynī Shahr | County | شهرستان خمینی شهر | 311,629 | 319,727 | → |
| Khūr va Biābānak | County | شهرستان خوروبیابانک | 17,793 | 19,761 | → |
| Khvansār | County | شهرستان خوانسار | 32,423 | 33,049 | → |
| Lenjān | County | شهرستان لنجان | 246,510 | 262,912 | → |
| Mobārakeh | County | شهرستان مبارکه | 143,474 | 150,441 | → |
| Nā'īn | County | شهرستان نائین | 38,077 | 39,261 | → |
| Najaf Ābād | County | شهرستان نجف آباد | 300,288 | 319,205 | → |
| Naṭanz | County | شهرستان نطنز | 42,239 | 43,977 | → |
| Semīrom | County | شهرستان سمیرم | 65,047 | 74,109 | → |
| Shāhīn Shahr va Meymeh | County | شهرستان شاهین شهرومیمه | 196,584 | 234,667 | → |
| Shahrezā [Shahreza] | County | شهرستان شهرضا | 149,555 | 159,797 | → |
| Tīrān va Karvan | County | شهرستان تیران وکرون | 69,047 | 71,575 | → |
| Iran | Islamic Republic | ایران | 75,149,669 | 79,926,270 |
Source: Statistical Centre of Iran (web).
Explanation: Area figures of counties are derived from geospatial data.
Further information about the population structure:
| Gender (C 2016) | |
|---|---|
| Males | 2,599,477 |
| Females | 2,521,373 |
| Age Groups (C 2016) | |
|---|---|
| 0-14 years | 1,103,546 |
| 15-64 years | 3,656,046 |
| 65+ years | 361,258 |
| Age Distribution (C 2016) | |
|---|---|
| 90+ years | 10,690 |
| 80-89 years | 71,973 |
| 70-79 years | 154,559 |
| 60-69 years | 307,776 |
| 50-59 years | 516,162 |
| 40-49 years | 709,072 |
| 30-39 years | 1,039,218 |
| 20-29 years | 883,560 |
| 10-19 years | 657,167 |
| 0-9 years | 770,673 |
| Urbanization (C 2016) | |
|---|---|
| Rural | 613,073 |
| Urban | 4,507,309 |
| Literacy (A6+) (C 2016) | |
|---|---|
| yes | 4,175,845 |
| no | 465,806 |