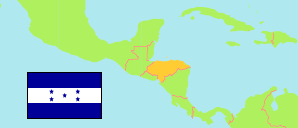
Islas de la Bahía
Department in Honduras
Contents: Subdivision
The population development in Islas de la Bahía as well as related information and services (Wikipedia, Google, images).
| Name | Status | Population Census 2001-07-28 | Population Census 2013-08-10 | Population Projection 2023-07-01 | |
|---|---|---|---|---|---|
| Islas de la Bahía [Bay Islands] | Department | 38,073 | 62,557 | 80,498 | |
| Guanaja | Municipality | 4,856 | 5,445 | 6,231 | → |
| José Santos Guardiola | Municipality | 9,030 | 11,334 | 12,693 | → |
| Roatán | Municipality | 21,724 | 41,831 | 56,358 | → |
| Útila | Municipality | 2,463 | 3,947 | 5,215 | → |
| Honduras | Republic | 6,535,344 | 8,303,771 | 9,745,149 |
Source: Instituto Nacional de Estadística Honduras (web).
Explanation: All population figures are adjusted for underenumeration.
Further information about the population structure:
| Gender (P 2023) | |
|---|---|
| Males | 38,980 |
| Females | 41,518 |
| Age Groups (P 2023) | |
|---|---|
| 0-14 years | 25,471 |
| 15-64 years | 51,184 |
| 65+ years | 3,843 |
| Age Distribution (P 2023) | |
|---|---|
| 80+ years | 731 |
| 70-79 years | 1,626 |
| 60-69 years | 3,436 |
| 50-59 years | 5,569 |
| 40-49 years | 8,738 |
| 30-39 years | 12,448 |
| 20-29 years | 14,542 |
| 10-19 years | 16,206 |
| 0-9 years | 17,202 |
| Urbanization (P 2023) | |
|---|---|
| Rural | 38,009 |
| Urban | 42,489 |
| Place of Birth (C 2013) | |
|---|---|
| Same municipality | 33,124 |
| Other municipality in Honduras | 28,417 |
| Other country | 1,015 |
| Ethnic Group (C 2013) | |
|---|---|
| Indigenous | 18,982 |
| Non-Indigenous | 43,575 |