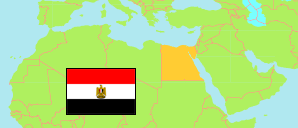
Al-Minūfiyah
Governorate in Egypt
Contents: Subdivision
The population development in Al-Minūfiyah as well as related information and services (Wikipedia, Google, images).
| Name | Status | Native | Population Census 1996-11-19 | Population Census 2006-11-11 | Population Census 2017-03-28 | Population Estimate 2023-07-01 | |
|---|---|---|---|---|---|---|---|
| Al-Minūfiyah [Monufia] | Governorate | المنوفية | 2,760,429 | 3,270,431 | 4,301,601 | 4,736,945 | |
| Al-Bājūr [El Bagour] | Markaz | مركز الباجور | 256,128 | 305,923 | 400,412 | 438,962 | → |
| Ashmūn [Ashmoun] | Markaz | مركز أشمون | 534,799 | 639,105 | 845,486 | 926,301 | → |
| Ash-Shuhadā' | Markaz | مركز الشهداء | 219,494 | 253,881 | 344,830 | 379,468 | → |
| Birkat as-Sab' [Birket el-Sab] | Markaz | مركز بركة السبع | 200,972 | 239,291 | 310,116 | 340,131 | → |
| Madīnat as-Sādāt [Sadat City] | Markaz | مركز و مدينة السادات | 95,191 | 143,075 | 178,012 | 198,025 | → |
| Minūf [Menouf] | Kism (fully urban) | قسم مدينة منوف | ... | 89,262 | 112,423 | 130,417 | → |
| Minūf [Menouf] | Markaz | مركز منوف | ... | 336,129 | 440,366 | 478,163 | → |
| Quwaysinā [Quweisna] | Markaz | مركز قويسنا | 318,273 | 382,457 | 494,312 | 541,112 | → |
| Shibīn al-Kawm [Shibin el-Kom] | Kism (fully urban) | قسم شبين الكوم | 156,794 | 177,112 | 239,624 | 277,991 | → |
| Shibīn al-Kawm [Shibin el-Kom] | Markaz | مركز شبين الكوم | 303,759 | 352,396 | 478,640 | 519,732 | → |
| Sirs al-Layyānah | Kism (fully urban) | قسم سرس الليانة | 44,267 | 52,653 | 69,909 | 81,097 | → |
| Talā | Markaz | مركز تلا | 264,204 | 299,147 | 387,471 | 425,546 | → |
| Miṣr [Egypt] | Republic | مِصر | 59,276,672 | 72,798,031 | 94,798,827 | 105,174,090 |
Source: Central Agency for Public Mobilization and Statistics (CAPMAS), Egypt.
Explanation: Some figures for 2006 are computed using preliminary census results. Area figures of districts are derived from geospatial data.
Further information about the population structure:
| Gender (E 2023) | |
|---|---|
| Males | 2,436,647 |
| Females | 2,300,298 |
| Age Groups (C 2017) | |
|---|---|
| 0-14 years | 1,495,622 |
| 15-64 years | 2,633,382 |
| 65+ years | 172,597 |
| Age Distribution (C 2017) | |
|---|---|
| 90+ years | 2,615 |
| 80-89 years | 18,301 |
| 70-79 years | 70,110 |
| 60-69 years | 203,143 |
| 50-59 years | 334,327 |
| 40-49 years | 433,579 |
| 30-39 years | 640,810 |
| 20-29 years | 708,787 |
| 10-19 years | 805,067 |
| 0-9 years | 1,084,862 |
| Urbanization (E 2023) | |
|---|---|
| Rural | 3,703,638 |
| Urban | 1,033,307 |