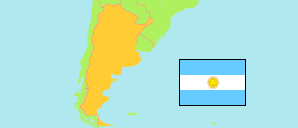
Entre Ríos
Province in Argentina
Contents: Subdivision
The population development in Entre Ríos as well as related information and services (Wikipedia, Google, images).
| Name | Status | Population Census 1991-05-15 | Population Census 2001-11-17 | Population Census 2010-10-27 | Population Census 2022-05-18 | |
|---|---|---|---|---|---|---|
| Entre Ríos | Province | 1,020,257 | 1,158,147 | 1,235,994 | 1,425,578 | |
| Colón | Department | ... | 52,718 | 62,160 | 75,305 | → |
| Concordia | Department | ... | 157,291 | 170,033 | 198,802 | → |
| Diamante | Department | 39,807 | 44,095 | 46,361 | 53,595 | → |
| Federación | Department | 48,713 | 60,204 | 68,736 | 78,691 | → |
| Federal | Department | 22,121 | 25,055 | 25,863 | 29,667 | → |
| Feliciano | Department | 12,366 | 14,584 | 15,079 | 16,803 | → |
| Gualeguay | Department | 43,026 | 48,147 | 51,883 | 57,303 | → |
| Gualeguaychú | Department | 89,726 | 101,350 | 109,461 | 126,147 | → |
| Islas del Ibicuy | Department | 10,692 | 11,498 | 12,077 | 14,000 | → |
| La Paz | Department | 61,896 | 66,158 | 66,903 | 75,407 | → |
| Nogoyá | Department | 37,230 | 38,840 | 39,026 | 43,195 | → |
| Paraná | Department | 276,160 | 319,614 | 339,930 | 391,696 | → |
| San Salvador | Department | ... | 16,118 | 17,357 | 20,854 | → |
| Tala | Department | 24,217 | 25,892 | 25,665 | 31,309 | → |
| Uruguay | Department | 86,198 | 94,070 | 100,728 | 116,356 | → |
| Victoria | Department | 30,126 | 34,097 | 35,767 | 40,652 | → |
| Villaguay | Department | ... | 48,416 | 48,965 | 55,796 | → |
| Argentina | Republic | 32,615,528 | 36,260,130 | 40,117,096 | 45,892,285 |
Source: Instituto Nacional de Estadística y Censos de la Republica Argentina.
Explanation: The results of the 2022 census are final.
Further information about the population structure:
| Gender (C 2022) | |
|---|---|
| Males | 693,547 |
| Females | 732,031 |
| Age Groups (C 2022) | |
|---|---|
| 0-14 years | 315,395 |
| 15-64 years | 937,518 |
| 65+ years | 172,499 |
| Age Distribution (C 2022) | |
|---|---|
| 90+ years | 6,409 |
| 80-89 years | 32,591 |
| 70-79 years | 77,973 |
| 60-69 years | 118,183 |
| 50-59 years | 146,269 |
| 40-49 years | 188,619 |
| 30-39 years | 207,862 |
| 20-29 years | 220,495 |
| 10-19 years | 222,671 |
| 0-9 years | 204,340 |